Tag Archives: optimization

Event Presentation: Digital Talks Spring’15 – What’s the craic? (May 2015, Istanbul)

In May 2015, I made a presentation about “Implications of digital and mobile transformation on user experience and measurement / analytics” in Digital Talks Spring’15.

For more details: http://digitaltalks.org/etkinlik/ilkbahar15/

The presentation I delivered can be found below:

http://www.slideshare.net/CemalBykgkesu/digital-talks-spring15-user-experience

Event Presentation: Digital Times Summit – Understanding the Digital User (March 2015, Istanbul)

In March 2015, I made a presentation about “Digital User Behaviour” in Digital Times Summit 2015 as a guest speaker of Bogazici University.


afis_v3_low_res


CAnNuC0UYAAjhwb


What were the key take aways from my presentation?

  • Although Descartes said humans are rational beings and all economic theories have been shaped based on this assumption, lots of decisions of people are based on irrational judgments.
  • 42% of world population (3 billion people) have access to Internet.
  • Half of the population that have access to Internet (1.5 billion people) are constantly connected which means they can connect to the internet whenever they want.
  • 24/7 connectivity enabled by mobile phones. There are 5x as many cellphones in the world as there are PCs.
  • Internet user penetration is lowest in South Asia (19%) and in Africa (26%).
  • By 2020, 5 billion new connected users are expected to join to the game. Mobile will play a key role in providing access to these 5 billion people.
  • Role of the Internet in the purchase journey is powerful. Today, more than 65% of decisions start on mobile devices but then go on to convert someplace else.
  • Today, people are visiting stores less than they used to but spending more when they are there. Thanks to Internet and digital research, consumers are much better informed and know what they want to buy before they enter a store.
  • Nearly half of marketers say, the most frustrating challenge is “Acting on data to improve marketing performance.”
  • The winning brands of tomorrow will be those who will make sense of data and act on data insights.
  • To be successful, brands need to apply 10/90 rule: If 10 dollars are invested in tools, 90 dollars should be invested in humans.


You can find the full presentation below:

http://www.slideshare.net/CemalBykgkesu/boun-digital-times-summit-2015-march-understanding-the-digital-user

Event Presentation: Learn with Google – Optimize Your Business Results: A look into Site Conversion Optimization & Digital Analytics (October 2014, Dublin)

2015-03-07_11-34-18

I delivered this presentation in a Learn with Google advertiser event in Dublin in October 2014.

[three_first]
BySz0WZCYAAFCm7
[/three_first][three_second]
BySvIuCCAAAHONE
[/three_second][three_third]
BySyhO4CAAAJbTr
[/three_third]

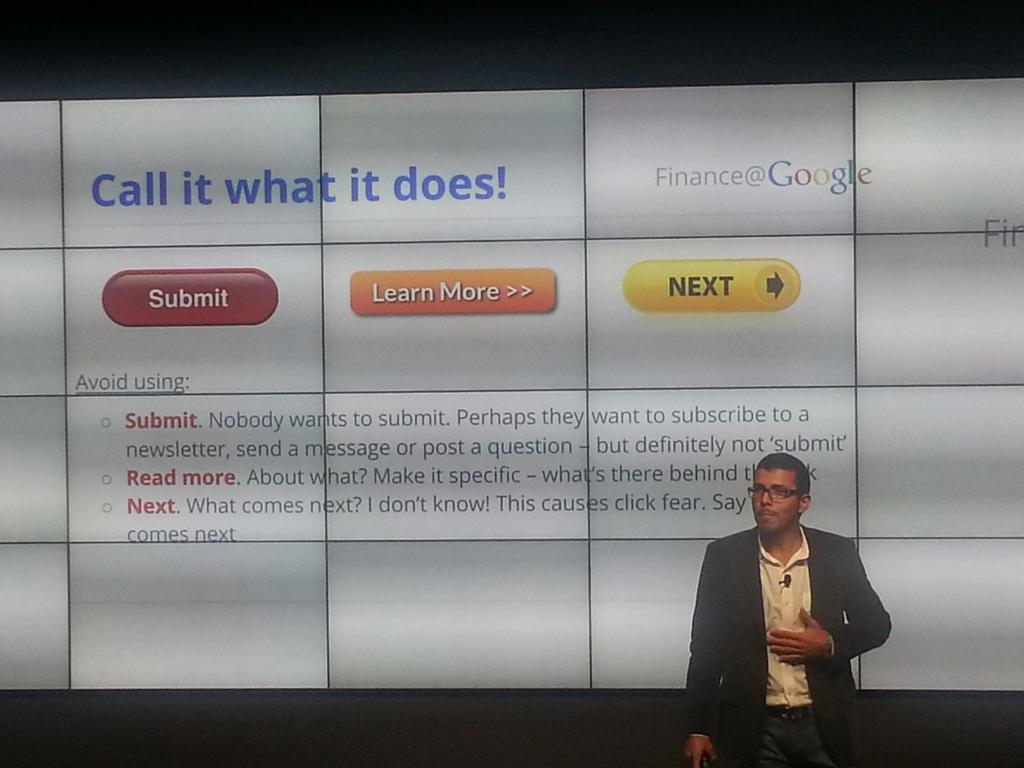
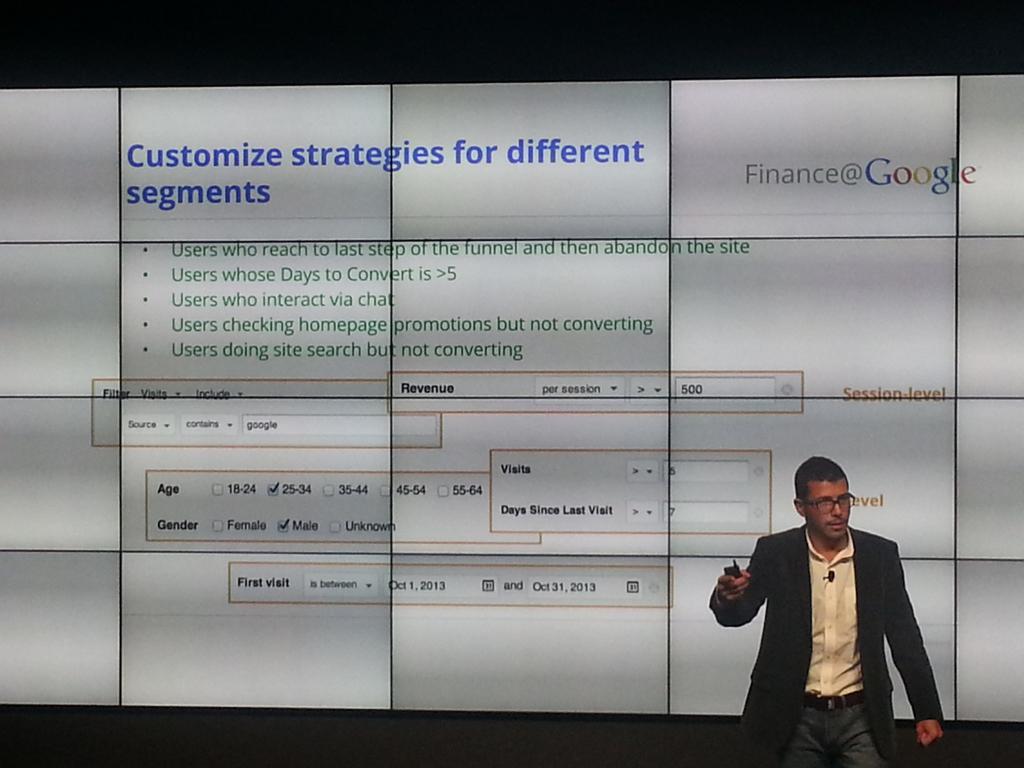
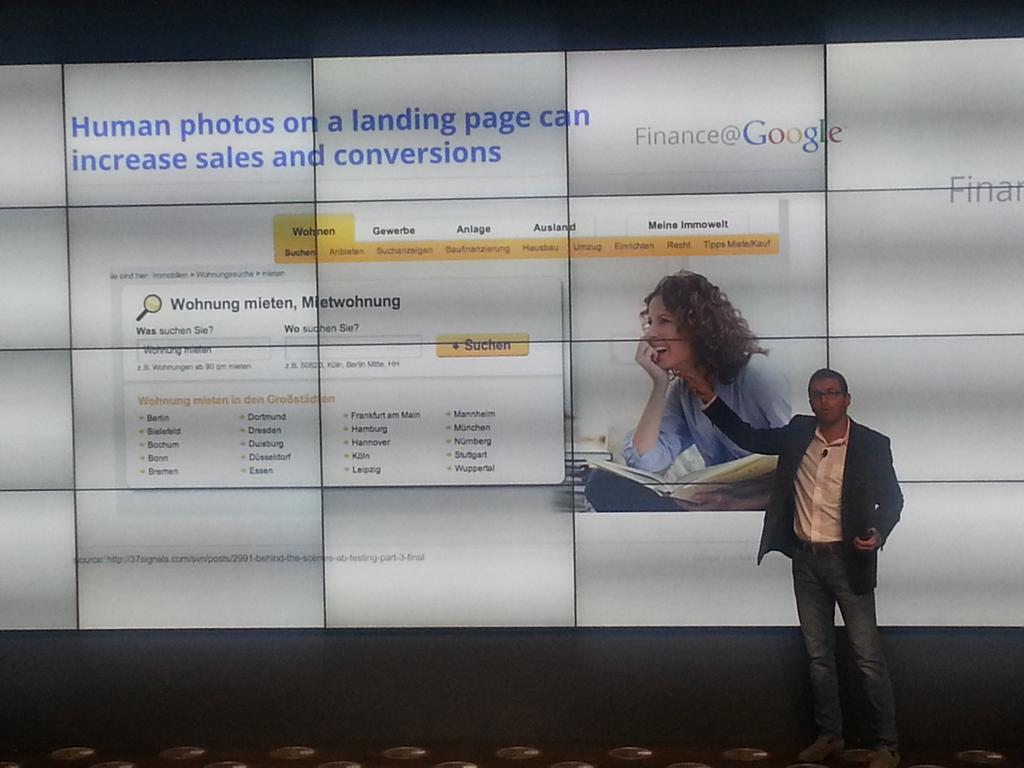
It focuses on optimizing business results by applying concepts of conversion optimization and by using benefiting from analytics insights. Some digital analytics segmentation and usability examples are shared in the presentation.

http://www.slideshare.net/CemalBykgkesu/copy-of-2014-conversionsgoogle-cemal-back-up-presentation

Event Presentation: MarketingTalks (June 2014, Istanbul)

BpTPsdWCAAAoT9g

I delivered this presentation in MarketingTalks event in Bahcesehir University in June 2014 in Istanbul (Turkish).

It focuses on understanding multiscreen user behaviour with the help of digital measurement tools data especially focusing on engagement and loyalty elements.

For more details: http://marketingtalks.org

http://www.slideshare.net/CemalBykgkesu/ok-ekranl-dunyada-kullanclar-anlamak-marketingtalks

Event Presentation: Learn with Google – Measuring and Optimising Apps using Google Mobile App Analytics (May 2014, Istanbul)

I delivered this presentation in a Learn with Google app developer event in Istanbul in May 2014. It focuses on measuring and optimising mobile apps using insights from Google Mobile App Analytics. I talk about better segmentation by focusing on creating views (filters) and custom dimensions. I also discuss on the fly segmentation concepts like user segments, default reports & insights in Google Mobile App Analytics.

http://www.slideshare.net/CemalBykgkesu/copy-of-mobile-app-analytics-istanbul-lw-g-event-short

Improve Conversions with Google Analytics

This article has been cross-published on Inside AdSense Blog.

Today, I’ll focus on ways to improve your site conversions using specific Analytics reports. Understanding exactly what drives conversions on your site is key to understanding important factors such as visitor intent and where you should invest in advertising. The following reports help you understand how to calculate page values, track conversions, and gain insights into visitor intent.
1. Calculate page values to understand which pages drive conversions and revenue
Page Value is a single number that can help you better understand which pages on your site drive conversions and revenue. Pages with a high Page Value are more influential than pages with a low Page Value. For example, e-commerce sites will usually notice that the most valuable pages on their site are their checkout pages. This makes sense because everyone needs to view the checkout pages before converting. Take a look for pages that get a lot of traffic (page views) but have a low Page Value. Why don’t these pages help conversion? Or should they? To answer some of these questions, get started by reviewing the Page Value column in the Site Content > All Pages report.
2. Use the Multi-Channel Funnels Report for better conversion tracking
Multi-Channel Funnels in Google Analytics let you look at interactions across different digital media and show how these channels work together to create sales and conversions. They also help you make crucial marketing decisions regarding advertising investments at the macro level (e.g. what channels) as well as the micro level (e.g. what keywords and ad placements). Your Multi-Channel Funnels reports can be found under the Conversions section in Google Analytics.
3. Use Site Search Report to get insights into visitor intent 
Google Analytics Site Search reports provide extensive data on how people use the search engine on your site. With this report, you can see initial searches, refinements, search trends, which pages they searched from, where they ended up, and conversion correlation. Tracking how people use the search box on your site can provide you with important insights into visitor intent. Your Site Search reports can be found under the Behavior section in Google Analytics. If you’re not already using a search box on your site, take a look at the Google Custom Search Engine.
To help you understand your page values and conversions, I’ve created a custom Content Evaluation Dashboard for you to download. Once downloaded, just select which profile you’d like to import. You can access this dashboard any time by clicking the ‘Customization’ tab.


Improve Your User Experience with Google Analytics

This article has been cross-published on Inside AdSense Blog.

I’ll take a look today at how you can improve your user experience with Google Analytics. Google Analytics gives you the insights you need to understand current user experience, as well as how the traffic to your site is influenced by social media. The following reports help you understand why site speed is important for an improved user experience, how to spot pages bringing the most AdSense revenue, and how to refine your social media strategy measuring the impact social media has on your site goals.
1. Improve user experience by improving site speed
Faster pages lead to better user experience and improved conversions. The Site Speed reports in Google Analytics give you detailed data on the speed of your site pages, as experienced by your users. Ensuring page load speeds times are below the average can help you differentiate your site. Analyze and speed up your site using PageSpeed products, and check the resulting improvements in Site Speed reports.
2. Use the AdSense Pages report to discover which pages help you earn the most
 
The AdSense Pages report provides data about which pages on your site contribute most to your AdSense revenue. With the insights from this data, you can replicate successful implementations on well performing pages on other parts of your site.
3. Use the social traffic sources report to refine your social media strategy
Social buzz is very important for many publishers to build their audience and retain loyalty and engagement. Social reports in Google Analytics help you measure the impact social media has on your business goals and conversions. With this report, you can track the number of visitors that social media channels bring to your site, measure the value of those channels by tracking conversions and AdSense revenue, and examine how your content is being shared across social networks. You can access Social reports under the Acquisition section in Google Analytics.
To help you understand user experience on your site, I’ve created a custom Social Dashboard and Site Speed Dashboard for you to download. Once downloaded, just select which profile you’d like to import. You can access this dashboard any time by clicking ‘Dashboards’ under the Reporting tab in your Analytics account.


Increase User Loyalty with Google Analytics

This article has been cross-published on Inside AdSense Blog.
It’s key to understand how engaged your users are and how they interact with your site. The following tips will help you use Analytics to visualize user interactions on your site, and understand why engagement and loyalty metrics matter.
1. Use In-page Analytics to see how your users are interacting with your site
In-Page Analytics provides clickthrough data in the context of your actual site, and is a highly effective tool to let you make a visual assessment of how users interact with your web pages. You can answer questions like “Are my users seeing the content I want them to see?” or “Are my users finding what they’re looking for on the page?” This feature also helps you determine the best location to place your ad units. You can access your In-Page Analytics through the ‘Behavior’ section on the Reporting tab.
2. Use Real Time reports to track user activity in real time 
Real-Time reports allow you to monitor visitor activity as it happens on your site. They help you understand how your systems are reacting, such as when you send out an email campaign or engage in marketing that is temporary in nature. Real-Time reports provide alerting, giving insight into things that are new or different such as a sudden increase in site traffic. Additionally, you can use them to measure the immediate impact of social media.
3. Increase engagement and loyalty on your site
Google Analytics provides you with behavioral reports that illustrate the engagement and loyalty aspects of your visitor behavior. The Frequency & Recency report lets you see the level of user interest in your site based on frequency of visits and length of time between visits. If visitors come once but don’t return, you might infer that your site content and design are not sufficiently engaging or not easy to navigate. Some additional relevant reports such as New vs Returning and ‘Engagement’ are available under the Audience section on the Reporting tab. For more detailed information about how site visitors interact with each page, I suggest you use the ‘event tracking method’ that Google Analytics evangelist Justin Cutroni shared on his blog to get an accurate measurement of which articles are actually read.
I’ve created a custom Engagement & Monetization Dashboard for you to download. Once downloaded, just select which profile you’d like to import. You can access this dashboard any time by clicking ‘Dashboards’ under the Reporting tab in your Analytics account.
Hangout: Google Analytics Best Practices for Publishers (July 2013)

In this video, together with AdSense and Analytics product managers, I am talking about some Analytics best practices.

We cover the following topics:
– AdSense Performance Reports tab.vs. Google Analytics
– Features in Google Analytics that aren’t available in AdSense
– Popular dashboards publishers should try
– Favorite Google Analytics functionality
– Examples of content experiments

Event Presentation: Userspots – UX Analytics (February 2013, Istanbul)

I delivered this presentation in Userspots UX Analytics event in Kadir Has University in Istanbul in February 2014.

The session focused on basic concepts and best practices on UX principles and usability. I also coveren some measurement tips for a better user experience.

http://www.slideshare.net/CemalBykgkesu/userspotsuxanalyticspresentation-externalversion130213055722phpapp01

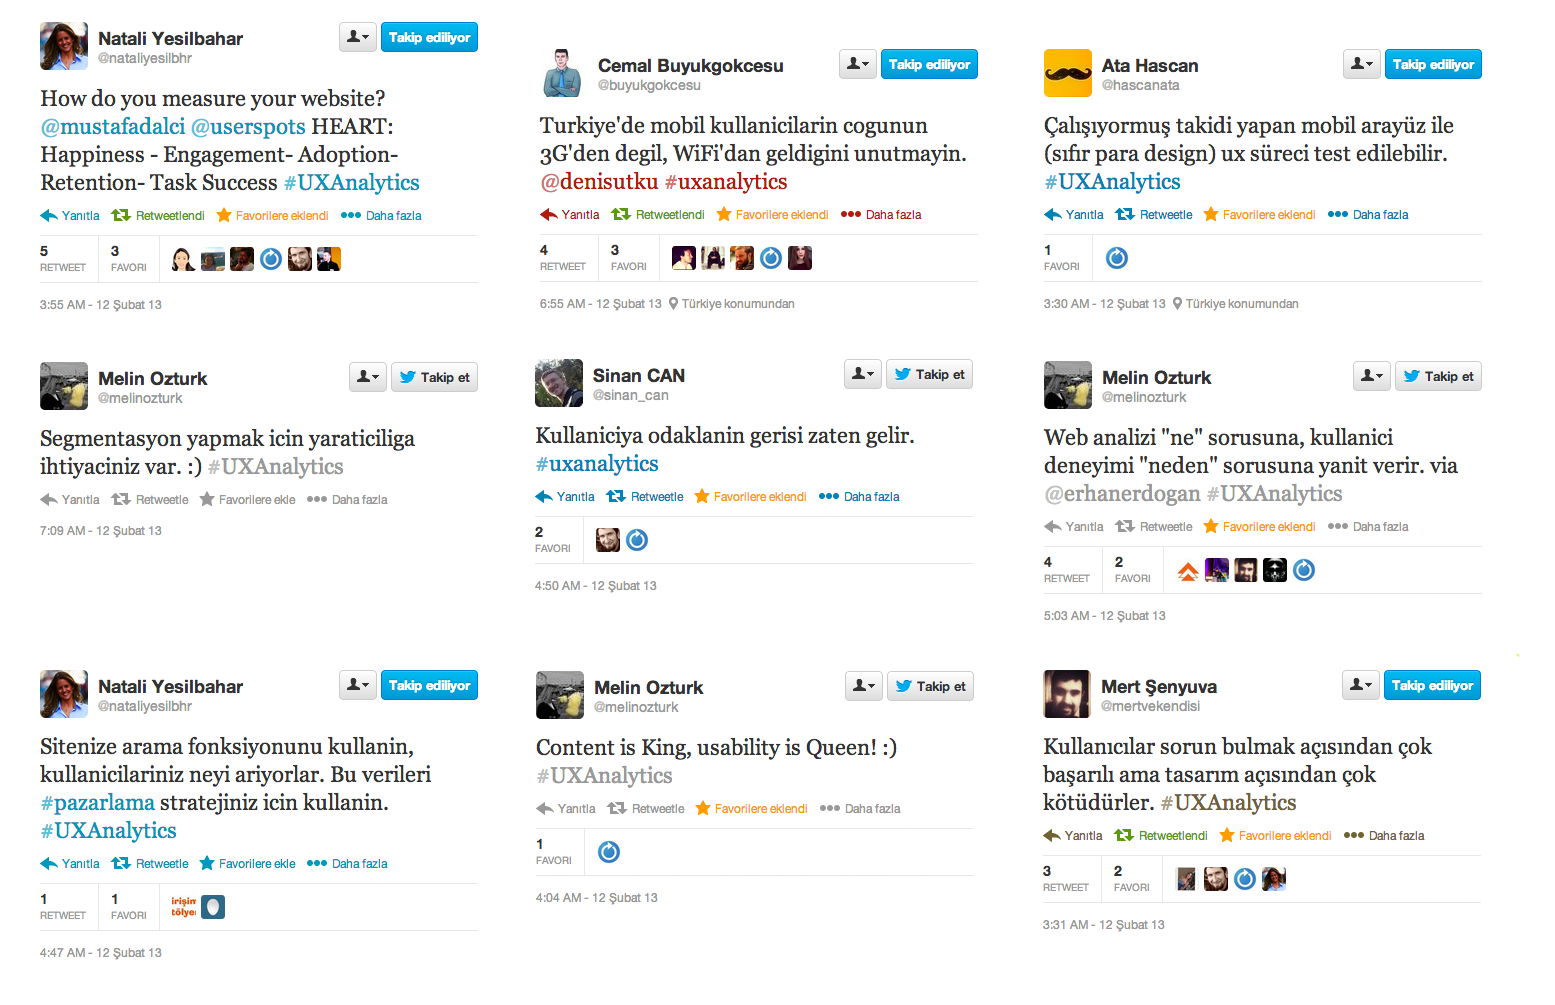
Etkinliğin yansımaları Twitter’da şöyle oldu:

hizala